The ultimate guide to sales prospecting

Table of contents
- What is prospecting?
- Is prospecting marketing or sales?
- Prospecting for B2B vs B2C
- B2B prospecting statistics
- Prospecting compliance
- Prospecting tools and software
- Prospecting best practices for different industries
- Sales prospecting methods
- Prospecting strategies and tactics
- How to create a B2B email prospecting strategy
- Prospecting metrics and performance tracking
- Sell more with Sopro

A complete deep-dive into what prospecting is, the different methods, tools, and strategies, along with an actionable outreach plan for engaging your ideal customers.
Making initial contact with your audience is the first step on the road to glory: another deal closed, another happy customer signed. So speaking to your prospects (each one a potential client, who would benefit from your awesome product or service) should be easy.
But 40% of sales reps cite prospecting as the most challenging part of their job.
In this guide to sales prospecting, we’ll first outline what prospecting is and what sales and marketing professionals think about it. We’ll then look at the different methods, tools, and strategies; outlining which approach is most effective, before giving you an actionable outreach plan for engaging your ideal customers.
If you’d like to get a quick overview of the guide, watch the video below where Shaine, Sopro’s Head of Sales will run through the basics.
What is prospecting?
Sales prospecting is the process of developing new sales opportunities by finding and contacting potential clients. It’s based on one-to-one outbound marketing activities, such as an email, phone call, or LinkedIn message.
Prospecting can build on your inbound marketing results, e.g. reaching out to someone who has already shown interest in your brand. Alternatively, it can function as a separate but complementary discipline, such as engaging a list of contacts that fit your buyer personas.
Inbound marketing’s the hottest kid on the block right now, so prospecting may not be something you’ve considered. Maybe it feels a bit ‘old-school’.
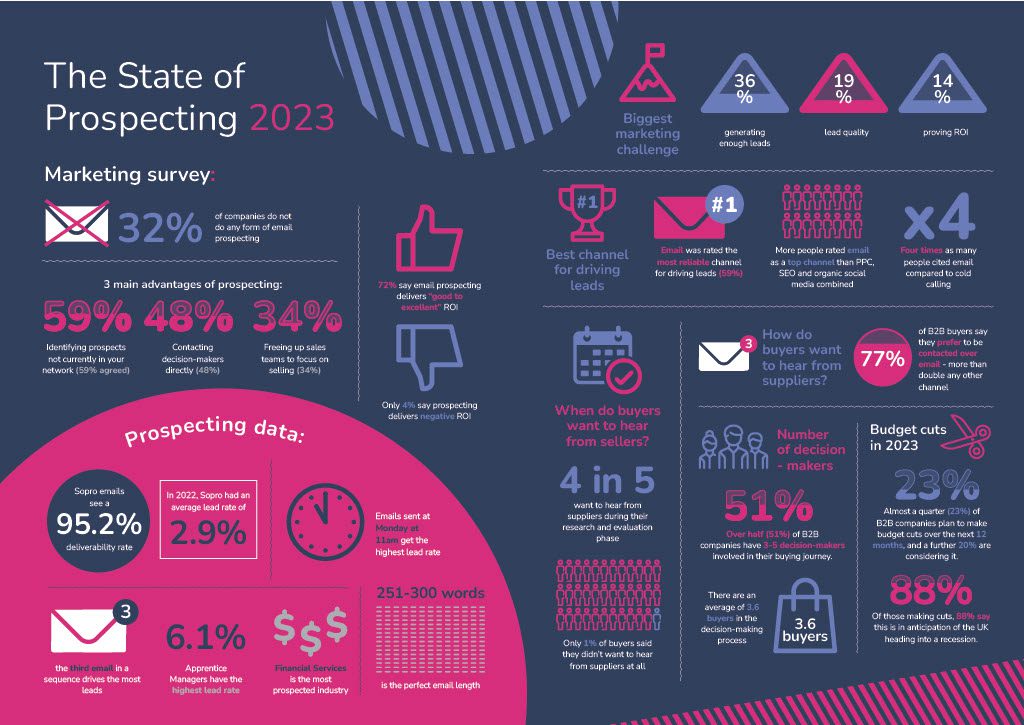
But a recent survey revealed that 4 in 5 buyers want to hear from suppliers during their ‘research and evaluation phase’, with only 1% saying they didn’t want to hear from buyers at all. So it’s important not to dismiss outbound marketing: active outreach can be a very fruitful first stage of the sales process.
Is prospecting marketing or sales?
Prospecting is often done by sales reps themselves, but in larger businesses, specialist Sales Development teams – complete with data researchers, strategists, and Sales Development Representatives (SDRs) – take on the role. The other option is the marketing team, although their talents might be better placed focusing on other lead generation efforts.
The ideal scenario is to keep your champion sales agents away from prospecting. For maximum results, sales reps should be focusing solely on selling.
This is where the marketing or SDRs can get savvy with smart prospecting solutions, creating a new channel for generating leads and allowing more time for the sales team to do what they do best.
Prospecting for B2B vs B2C
Prospecting for B2B and B2C companies can have some significant differences.
| B2B prospecting | B2C prospecting |
|---|---|
| Targets businesses and organisations | Targets individual consumers |
| Long sales cycle | Short sales cycle |
| Complex products or services with integrations | More straightforward products |
| Smaller customer base, higher average sale value | Large customer base, lower average sale value |
| Decisions made by committees | Decisions largely made by individuals |
| Messaging focuses on pain points, efficiency and ROI | Messaging focuses on emotions and personal benefits |
| Channels: email, LinkedIn, events, referrals, telemarketing, webinars | Channels: influencer marketing, PPC and display ads, content marketing, etc |
B2B prospecting statistics
All of these prospecting statistics come from a survey of 359 UK B2B sales and marketing decision-makers, carried out by consumer research company Sapio on behalf of Sopro. Benchmark results from Sopro client campaign results for 2022. To read more, download our prospecting whitepaper.
Sales prospecting statistics
- 4 in 5 buyers want to hear from suppliers during their research and evaluation phase
- Only 1% of buyers said they didn’t want to hear from suppliers at all
- When asked to pick their biggest marketing challenge, 36% of B2B decision-makers said generating enough leads, 19% said lead quality, and 14% said proving ROI.
- When asked to pick the main advantages of prospecting, the top answers were:
- Identifying prospects not currently in your network (59%)
- Contacting decision-makers directly (48%)
- Freeing up sales teams to focus on selling (34%)
- 72% of B2B professionals say email prospecting delivers good to excellent ROI
- Only 4% say prospecting delivers negative ROI
Email prospecting statistics
- Email is rated the most reliable channel for driving leads (59%)
- More people rate email as a top channel than PPC, SEO and organic social media combined
- Four times as many people cited email as an effective lead generator compared to cold calling
- 32% of companies don’t do any form of email prospecting
- Outreach emails sent on Monday at 11am have the highest lead rate
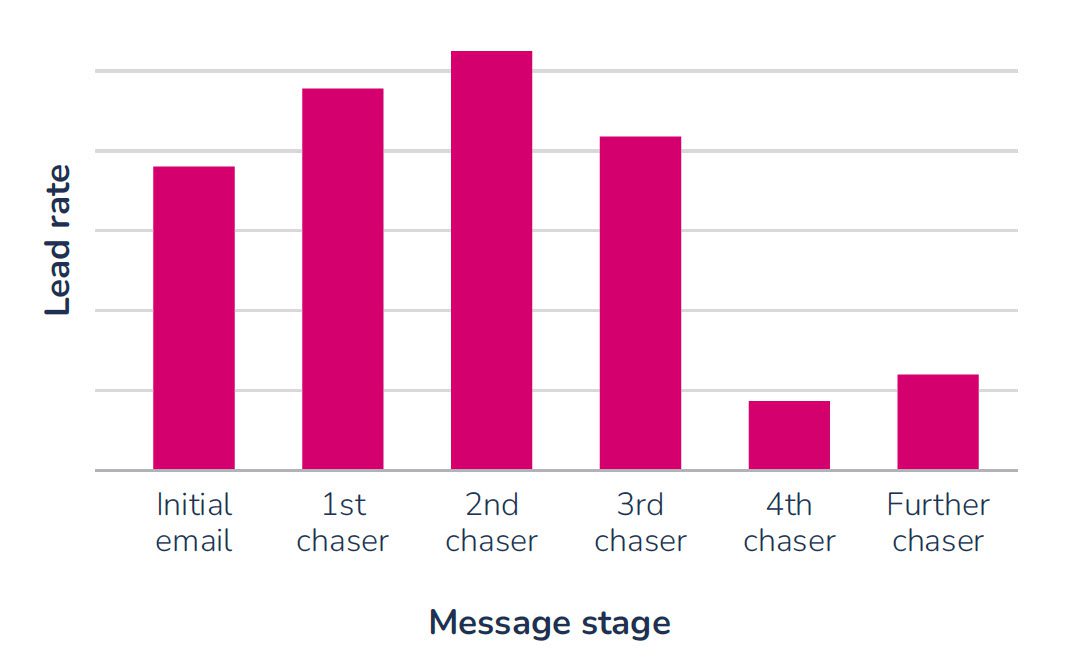
- The third email in a prospecting sequence drives the most leads
- The perfect sales email has between 251-300 words
Prospecting compliance
Any form of sales outreach means data, and anywhere there’s data, compliance needs to be too.
GDPR, PECR, CAN-SPAM, CCPA … different locations and situations have different regulations, all with their own alphabet-soup title. That’s why compliance must be built into all your sales prospecting activity – right from the start.
“With B2B, you’re not expected to actively ask for consent when processing data – you can send direct marketing to business contacts if there’s ‘legitimate interest’.“
Prospecting tools and software
Prospecting is hard work, but you can really increase efficiency by using prospecting software and tools.
CRM (Customer Relationship Management) software helps you manage and organise customer data. This will include communication history and sales activity. Examples of CRM software include Salesforce, Hubspot, and Pipedrive.
Marketing Automation software is designed to help automate and streamline marketing tasks, such as lead generation and social media management. Examples of marketing automation software include Marketo, Pardot, and Infusionsoft.
Prospecting data tools help you build a list of prospects to reach out to. The most commonly used is LinkedIn Sales Navigator. Inventive SDRs can also use AngelList, Product Hunt, and review sites like G2 Crowd as part of their research.
Email outreach software is designed to automate and personalise the sending of extensive email campaigns. You can either use specialist software – the kind we’ve built at Sopro to run your campaigns on – or general email software like Mailchimp or Campaign Monitor. Bear in mind these are not built to run intelligent prospecting campaigns.
Prospecting best practices for different industries
The framework in this guide is a great starting point for prospecting best practice, but your actual campaign will need to be tweaked and fine-tuned depending on which industry you’re targeting.
Each sector has different factors that can impact your prospecting. Despite selling the same product or service, you’re often targeting different needs and pain points. The buying process can differ, along with the regulations, compliance, and the number of decision-makers you need to contact.
And that’s before you even start sending emails, nail your messaging, and tackle the dense technical language… luckily we’ve created a series of guides for our most popular client industries.

Sales prospecting methods
You can carry out sales prospecting using a variety of channels and methods, each with its own advantages and disadvantages. The method which is most likely to fill your sales funnel may depend on your industry or business. Here the most common channels for sales prospecting.
Cold emailing
Email is surely the prospecting channel that has had the biggest technological revolution in the last few years.
Advances in data mean that campaigns can be targeted purely at qualified prospects who are a good fit for your business. Clever personalisation connects with prospects on a personal level, even when sent at scale. An email doesn’t interrupt someone’s day like a phone call, or apply pressure with a hard sell.
However, email does have hurdles for the inexperienced. Without the right technical set-up and expertise, emails can be flagged as spam and even hurt your domain. Gathering data manually is too resource-heavy to be cost-effective, but if a list is bought it might be inaccurate. And then there’s compliance to worry about.
Still, there’s a good reason to find expertise and get it right: when asked to pick which channels they prefer sellers to contact them on, 77% of B2B buyers said email – more than double any other channel.
Cold calling
The advantage of cold calling is that it’s all about people. You can have personal conversations with potential clients to build and nurture relationships. Speaking to your target audience on the phone means you get immediate feedback on everything; from targeting to website to product.
However, the disadvantages are fairly clear:
- On average, it takes eight attempts to reach a prospect
- Just 1% of cold calls lead to appointments
- 90% of top B2B decision-makers do not respond to cold outreach
Added to that is the potential reputational impact. Nobody wants to be branded a nuisance, and interrupting people with a hard sell can be seen as just that.
Events
Events can be a great way to build brand awareness, and provide an opportunity for face-to-face conversations with the right people. As many as 81% of B2B event attendees are decision-makers and have buying authority, so the appeal is clear.
However, events can be expensive to attend and time-consuming to plan, and the limited number of attendees means a smaller pool of prospects.
Webinars
75% of B2B marketers agree that hosting a webinar allows them to reach and engage new leads. In contrast to in-person events, they’re inexpensive and there’s no upper limit on attendees (so long as you get the tech right!).
Making sure your audience is relevant should be achieved through a mix of the webinar topic and the promotion, but can be a struggle. While webinars are less cost and time-intensive to plan, limited audience engagement can make the experience less engaging for participants, and following up can be difficult compared to other prospecting strategies.
Social selling
70% of sales reps are active on LinkedIn as part of their role, and it’s easy to see why. Despite the inspirational humblebrags and cringey selfies, it’s actually the perfect place to connect with professionals.
Social media is a low-cost business development solution, allowing you can reach a wide audience with specific targeting to find your ideal customers.
The main issue is how labour-intensive it can be. Manual search-and-message can work well if you’re a small business, but it just doesn’t scale. The conversion rates can be fairly low too.
Approaching a prospect on LinkedIn can feel spammy: the same message sent by email can have a far higher response rate, and if enough people mark that they don’t know you, LinkedIn will stop you from sending more messages.
The trick is to use a two-pronged attack. Combining social media with email outreach – known as social prospecting – can offer the best of both channels.
Referrals
Referrals are a brilliant way of attracting new clients. The quality of the leads is often excellent, with low acquisition cost and high customer retention rates. You should definitely have a referral marketing strategy in place.
On the downside, it’s not reliable or scalable as a sales prospecting technique. Referrals come and go organically, even with a solid reward programme in place. So while they may be amazing icing for your lead generation cake, they can’t be the sponge.
Prospecting strategies and tactics
Once you’ve chosen which channel you’re going to use, there are different strategies and tactics that can be adopted as part of your campaigns.
Account-based marketing
Account-based marketing sees you target a list of specific businesses that would be your ideal customers. With prospecting, you can engage every relevant decision-maker in the business.
Multi-channel prospecting
Multi-channel prospecting uses multiple marketing channels to reach your target audience. It brings together email, phone, social media, display ads and direct mail. It aims to find potential customers in multiple places to increase the chance of making a successful sale.
Lead nurturing
Lead nurturing is the process of building relationships with potential customers through targeted communication, in order to move them closer to the purchase decision over time.
How to create a B2B email prospecting strategy
Although there’s value in all of the above channels, for us (Sopro, the email prospecting experts) it might not surprise you that email is the channel we recommend you start with.
Of course we’d say that – but then the majority of B2B buyers would too. Our survey shows they far prefer email over any other channel when it comes to hearing from suppliers. And we know it works as the perfect foundation on which to build your B2B sales prospecting machine.
To do email outreach right, you need to ensure:
- Excellent technical set-up
- A highly-targeted, compliant prospect list
- A conversational introduction with advanced personalisation
- A sequence of follow-up emails
- Performance tracking and optimisation strategies
Technical set-up
The technical specifications behind email deliverability are a complex puzzle, solved by an army of very clever tech people whose desks often have six monitors. It makes the do-it-yourself approach pretty unworkable.
If you’d like to dive into the world of email deliverability – including SPF, rDNS, ESP, DKIM and MX records – you can read all about it here: Getting emails to inbox
Know your ICP
Before you get started, you need a strong, codified understanding of your potential customers.
The same is true of any marketing channel, but especially so with outbound sales prospecting. If you don’t make sure contacts are a good fit before you send an email, then your sales team will spend most of their time qualifying leads rather than selling.
Read more: How to create an ideal customer profile.
Source great data
So you’ve got your ICP sorted and know who to sell to. And instantly, you’re faced with the next challenge. How do you get a list of these people and get their contact details?
Your prospecting data needs to be filled with your target audience, and not any old Tom, Dick or Harry just because you happen to have their details. Their contact information must be accurate and up to date.
So while you can gradually build your own list from inbound methods, web-scraping tools, or hunting manually on LinkedIn, 75% of companies turn to an external partner to source their B2B prospecting data. In this case, you have two options: head to a specialist prospecting agency like Sopro (well, there are none quite like Sopro ????), or you can buy information from data brokers.
Check out our guide on building the perfect B2B database.
Market segmentation
Segmenting your prospecting campaigns can improve results and help you find new audiences and markets. There are five different types of market segmentation. Testing different approaches should reveal the most suitable for you.
Mailchimp studied 18 million emails sent to segmented lists. These emails had open rates 14.3% higher than non-segmented lists, click-through rates doubled, and unsubscribe rates were 9.4% lower.
Writing the perfect email
As this list is proving, there are many different elements to effective prospecting. But if any one element is more important than the others, it’s the message you send.
As part of our State of Prospecting 2024 whitepaper, we analysed the content of 49.5 million emails to find the rules shared by the top-performing email templates.
Subject lines
The top subject lines have between three and seven words, – open rates are 14.9% higher for those who stick to this rule. Including the prospect’s name, or the words “coffee” or “partnership” can increase open rates by up to 27%.
Email copy
Here are our eight golden rules for prospecting emails:
- “I’m on the train!”
To nail that natural, conversational tone, imagine you’re on a train, firing off a last-minute email to a prospect you’ve found on LinkedIn just before you arrive at your stop.
- Never open with a question
Don’t ask questions. It’s makes your prospect do work before you’ve even demonstrated how you can help.
- Follow the six-part template
Your templates can change based on who you’re targeting, but the magic formula remains the same:
- Greeting
- Softener
- Introduction
- Rationale behind your contact
- Call to action
- Proper email signature
- Review your work
Take a minute to place yourself in your prospects’ shoes. Would your email stand out and entice a response?
- Use concise language
Long, rambling emails are destined for deletion. Your prospects are busy people – they don’t wont to waste their precious time on a potentially futile endeavour. So get to the point, fast. Between 251-300 words is the sweet spot.
- The ten-year-old test
Would a ten-year-old understand your email? Get rid of any overly complicated language or jargon.
- The value exchange
Your prospect is spending time reading your email and you’re asking them for more of their time to have a call with you. What are you bringing in exchange? Explain how you could solve a pain point or help them sell more.
- Drop the hard sell
Identify your prospects’ challenges, and highlight the benefits of your solution.
You’ll have to read the full whitepaper for all the words, personalisation variables and other elements that impact email templates positively.
The State of Prospecting 2024
An in-depth look at the tactics and trends shaping successful B2B prospecting in 2024.
Download itFollow-up emails
A large part of what sets modern B2B prospecting apart from the old spammy mass email approach is the follow up. When you know you’re speaking to people who could benefit from what you offer, it’s worth seeing if they were just too busy in the moment your email landed to respond.
Amazingly, 70% of unanswered sales emails aren’t followed up. But Sopro’s analysis of 49 million emails shows that 76% of all your leads come from emails two, three and four.
Sending more than three chaser emails is a fairly fruitless endevour, and will annoy your target audience. If they don’t want to talk to you after four emails, you’re better off leaving them alone.
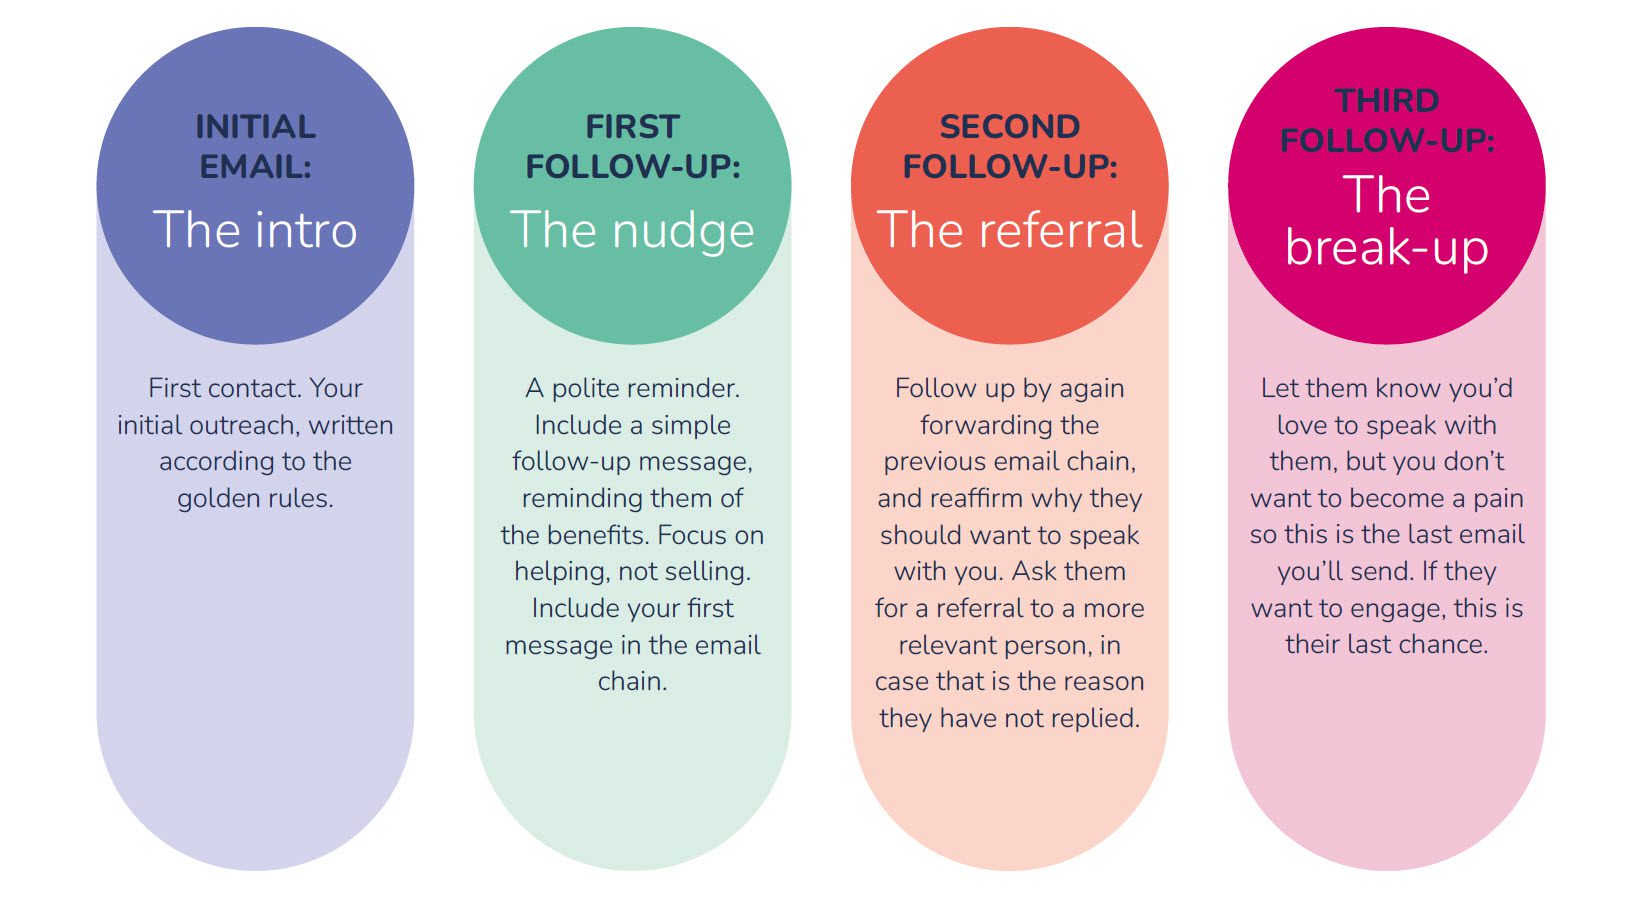
But you shouldn’t just send the same email four times in four days, or follow up with a “just bubbling this up”.
Instead, send them a few days apart (pro tip: but not on the same day of the week). Each email should have a slightly new approach with a different purpose.
Prospecting metrics and performance tracking
Another reason email prospecting is a great business development method is that everything can be monitored, so it’s easy to see what’s working and what can be improved.
Performance tracking is essential for evaluating the success of your lead generation efforts and identifying areas for improvement. Prospecting metrics cover everything from time sent, open rate, click-through rate, conversion rate, cost per lead, and customer acquisition cost.
All of this data allows you to test different approaches. You can AB test subject lines, for example, and see which gets more opens.
Tracking performance over time allows you to benchmark your own efforts, and compare it to industry benchmarks. This will help you better understand your prospecting efforts and make data-driven decisions.
Sell more with Sopro
Sopro helps you sell more. Our fully-managed B2B prospecting service drives new sales enquiries from your ideal customers, and our sales engagement platform is packed with cutting-edge features to optimise your outreach and nurture your leads.
Sopro combines a cutting-edge platform, world-class data, and unrivalled prospecting experience. We source your ideal prospects, engage them with personalised emails, and connect them directly to you when they are ready to talk business. The Sopro platform then helps you to nurture and engage each lead until you close the deal.


Share