Success stories
It’s really opened the door to some significant companies we’d previously struggled to reach… The ROI from the Sopro campaign has been very, very positive.


Credit insurance
4,000+ employees
Over the course of our relationship, Sopro have become our number one GTM partner during a period of exceptional business growth… Thanks to their expertise, we have closed a transformative deal worth in excess of £500,000.

Education and Training
201-500 employees
We wanted to expand and diversify our client base beyond our existing network but needed to focus on serving our current clients, not business development. Sopro was the perfect fit.

Marketing Services
11-50 employees
It’s always nice opening your emails in the morning and seeing that you have another qualified lead to reach out to.
Research Services
500-1000 employees
We’ve achieved exceptional ROI, ranging from 50% up to 620% especially in niche territories.

Manufacturing
1,001-5,000 employees
Our results
 2,861
Clients
2,861
Clients
 22,839
Campaigns
22,839
Campaigns
 91,384,357
Outreach messages
91,384,357
Outreach messages

Video case studies
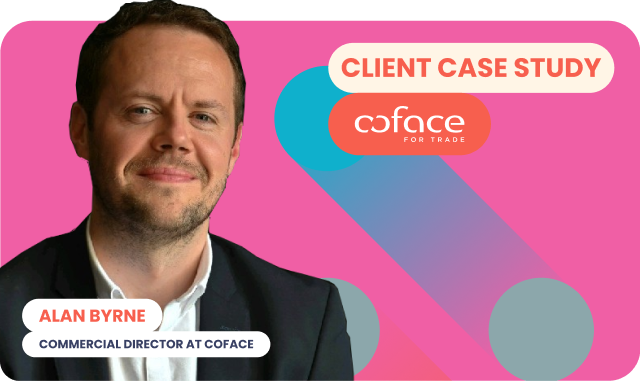
Coface
This credit insurance provider gained a steady flow of high-quality leads, connecting with significant companies and driving impactful business growth....
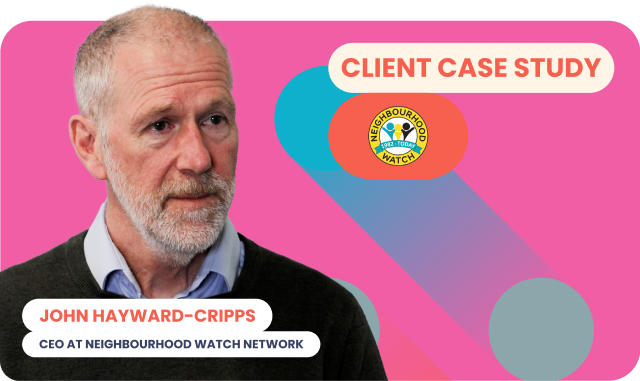
Neighbourhood Watch
Neighbourhood Watch benefited from a steady flow of high-quality leads – securing valuable partnerships within weeks, enabling expanded...
Wooshii
This video production agency partnered with Sopro to drive business growth. By leveraging multi-channel prospecting strategies, Wooshii achieved...
On IT
This IT services client benefited from dependable lead flow — securing their first client within six weeks, enabling staff expansion,...

Moneyinfo
This fintech firm gained a consistent flow of high-quality leads, engaging ideal prospects and driving significant business growth. This enhanced...

On Device
On Device Research streamlined sales with Sopro, securing steady leads across global markets and enabling their team to focus on...
MD2MD
This leadership organisation strengthened its sales pipeline with Sopro, connecting with senior decision-makers and driving membership growth. This...
OffScrip Health
This healthcare podcast network expanded its reach with Sopro, building a steady lead pipeline, engaging new audiences, and...

Culinary Artistas
This cooking experiences company partnered with Sopro to scale lead generation and foster long-term growth. The partnership helped...
CopyHouse
CopyHouse boosted its lead flow with Sopro, allowing them to focus on building a robust sales process while consistently engaging...

Write Arm
This content agency gained a reliable lead flow, driving consistent new business opportunities, enabling growth, and delivering impressive ROI.