How to manage your sales pipeline to close more sales
Summarise this article with:


In this blog...
- Sales pipeline definition
- Sales pipeline stages
- Optimising the sales pipeline
- 1. Follow up prospects
- 2. Regularly clean your pipeline
- 3. Monitor pipeline metrics
- 4. Automate
- 5. Understand prospect timescales
- 6. Keep the sales cycle short
- 7. Start lead scoring
- 8. Nurture into the pipeline
- 9. Develop content for the whole journey
- 10. Beyond CRM numbers
- 11. Create a standardised sales process

A sales pipeline might seem like a theoretical idea from a marketing textbook. You might view charting and optimising it as a “nice to have” that you’ll never get round to. Or you might be wondering what on earth a sales pipeline is.
While the graphic of the pipeline might seem theoretical, each section focuses on real-world topics: sales and marketing alignment, following up on prospects, lead scoring, lead nurturing, improving sales, and so on.
In short, each step of the pipeline represents a factor that can be tweaked to improve your sales. A study by HBR has shown companies that formally define their sales process generate 18% more revenue than those that don’t.
Sales pipeline definition
A sales pipeline is a visual representation of your sales process. By breaking the journey into different sections, it becomes possible to analyse and optimise each step of the sales process.
Starting with a stranger being introduced to your business, your sales pipeline will take them through every step on their way to being a customer.
A good sales pipeline will be able to estimate how many sales are expected to close in any given period. It can also reveal how that total is split between sales reps.
A note on funnels and pipelines
A sales funnel refers to the journey a person goes through from being a stranger to your business (and your business being a stranger to them) all the way through to being a customer and even a promoter.
The two concepts are related, but distinct from each other. If you want to know more about how the two relate and what the differences are, read our sales funnel vs sales pipeline post.
A quick summary:
- A sales pipeline is the sequence of actions your team takes that move a person from a lead to a sale
- A sales funnel is a visual representation of the success rate and drop-offs at each stage in the marketing to sale process
Sales pipeline stages
Here’s a typical sales pipeline graphic:
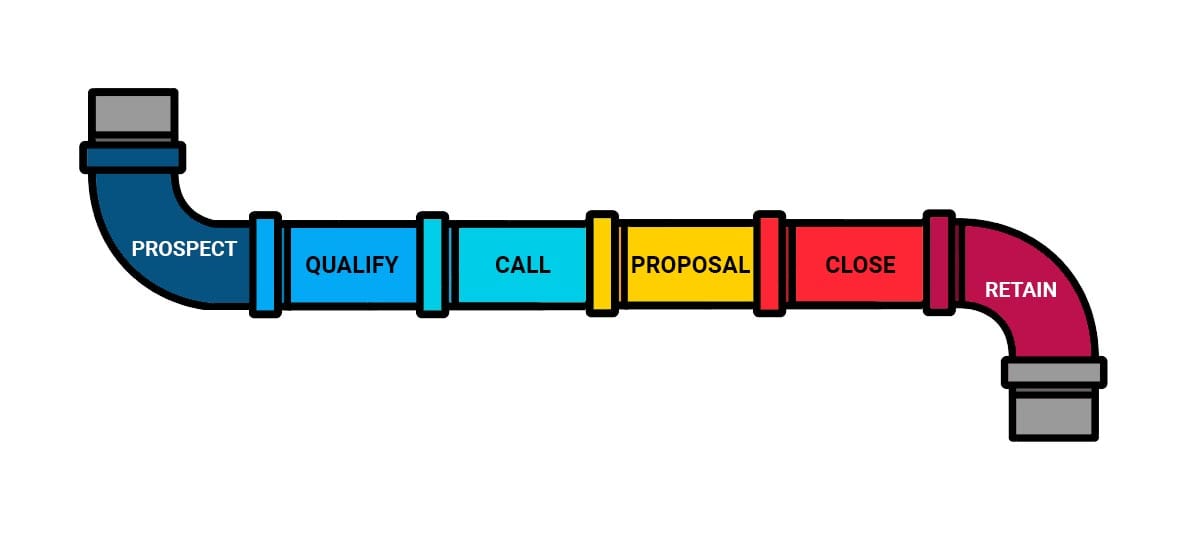
Personally, I think sales is much more exciting and dynamic than plumbing, but a pipeline is what the sales and marketing world has gone for so that’s what I’m explaining.
In a simple sense, here’s what it represents:
- Inbound and outbound marketing provides your business with leads
- Your sales team qualifies their interest and connects with high-quality leads.
- They demonstrate how your products or services solve a lead’s pain points
- And ultimately close the deal
For perfect sales pipeline management, we need to understand each stage of the journey in a little detail.
Stage one: Prospecting
OK, obviously you can generate your leads via any inbound or outbound marketing method. But we’re a prospecting company, so for us, the first stage of the pipeline involves email prospecting.
This stage actually contains a complex process that has various stages in its own right. Once we’ve worked our magic and the positive responses start flooding in, we move to the next stage.
Stage two: Qualify leads
Stage two involves qualifying the leads that come in to make sure sales reps don’t waste time on low-quality leads.
Sopro’s sales team don’t actually use this step for every type of lead. Prospecting leads need little to no lead scoring, in contrast with inbound marketing leads. As prospecting only targets carefully identified prospects, these leads come pre-qualified.
However, for most channels, ensuring the leads match your buyer profiles and that interest and budget is genuine is key to making sure your sales pipeline doesn’t get clogged.
Stage three: The call
Stage three is the all-important sales call. In reality, this could be multiple calls, remote video calls or face-to-face meetings.
The sales team work their magic, understanding the prospect’s needs and how to help.
Stage four: The proposal
A proposal is developed, allowing the team to understand how complicated or straightforward the prospect’s needs are.
Negotiations and refining the offer can happen before we move on to the next stage.
Stage five: The close
The deal is closed. The giant sales gong is rung once again.

Stage six: Retain
Sales hands over to client services, who begin the onboarding process. Marketing material switches from awareness to advocacy, helping client’s get the most from the product.

What is a sales funnel? A practical guide
What a sales funnel is, why it can be a game-changer, and how to build one that turns clicks into customers.
Read the guideOptimising the sales pipeline
A successful sales pipeline is one that allows sales to drive contacts as efficiently as possible from the intro to the close.
One way to analyse shortages, blockages and failures in your sales pipeline is to analyse and take insights from your funnel.
A pipeline without movement is just a list of leads. By conducting a sales pipeline review on a regular basis, you’ll create a faster flow toward more closings.
It is when you analyse and track your sales pipeline that you can truly optimise your sales enablement strategy and accelerate the conversion rate.
And here’s how.
1. Follow up prospects
We are in the age of the customer, where every prospect has access to reviews, comparisons, social media discussions and improved customer service.
Buyers now have more choice than ever and want to know they are making the right decision.
Our experience in prospecting shows that three follow-up emails need to be sent to gain the highest response rates and connect with prospects.
The best salespeople follow up on leads to ensure they maximise the number of people entering the pipeline.
2. Regularly clean your pipeline
The 80/20 rule holds true: just 20% of your leads are going to provide 80% of your revenue.
So you need to sort the wheat from the chaff.
Regularly review your leads to identify those which have been stuck at a particular stage in your pipeline for longer than expected. Then qualify them or reclassify them as a future prospect.
3. Monitor pipeline metrics
The sales pipeline is an ever-changing beast, and the only way to continually manage and optimise it is to monitor the key sales metrics in it:
- Number of qualified leads
- Customer acquisition costs
- MQL to SQL conversion rate
- Average sales cycle
- Win/close rate
4. Automate
Use automation to remind the team to check in on sluggish leads.
Schedule a follow-up call or email, or get really smart with deal-rotting features in your CRM to pinpoint who’s wasting away in your pipeline.
5. Understand prospect timescales
Regular communication helps you understand a lead’s timescale.
If you discover that someone is interested in your service but will not have available budget till next April, or are locked in with an existing supplier, you can recategorize them.
This way you can create a short, medium and long-term pipeline that ensures consistent sales over time.
The only prospects who should be in your active pipeline are those who are likely to close within your normal sales cycle.
6. Keep the sales cycle short
Having said that, you want to keep the sales cycle short where you can.
B2B sales cycles can be long. On average, six to nine months.
This can affect sales conversion rates – the more sales velocity drops, the more chances prospects have to change their mind.
Tip: Read our guide to speed up your sales cycle.
7. Start lead scoring
Scoring leads is a great way to automatically evaluate them – and it helps accelerate your sales pipeline.
If a lead has a serious interest, an immediate need for your product or service, as well as the authority to make a decision and allocate the budget, it’s a well-qualified, high-scoring lead and should be placed straight into the CRM pipeline immediately.
Yet even marketing qualified leads (MQL) may need qualifying further before they are hurled into the pipeline.
Of course, this means the pipeline will be tighter but it is likely to generate more sales.
8. Nurture into the pipeline
The pipeline should be clear of leads who are not ready to buy.
Create a separate list of casual browsers unlikely to make a deal in the foreseeable future – and then let the marketing team nurture them.
This speeds up the pipeline sales because it allows reps to focus on the well-qualified leads while marketing work on nurturing leads that can enter the pipeline later.
And it has been shown to produce 20% more sales opportunities in the longer run.
9. Develop content for the whole journey
For the marketing team to successfully nurture those leads, sales should give regular input into content creation and feedback.
Alignment between the two teams can help develop sales enablement content that reinforces messaging and provides value at every stage of the pipeline.
10. Beyond CRM numbers
Sales pipeline management is not just tracking CRM numbers – it’s asking ‘what can I do differently today to win more deals?’
Sales pipeline management allows sales departments to drill down into the numbers to see where the blocks are, where shortages are and where their actions can accelerate the sales cycle.
To avoid this, you need to make sure that you’re keeping details up to date on every single lead by adding regular notes and information for each stage of the sales process.
11. Create a standardised sales process
Every prospect is different, and every salesperson is different. This does not mean that you should just leave each rep to do whatever they want.
Underneath all the differences, your target customers have many needs and issues in common.
Allowing flexibility within a framework, designed by someone with more sales experience and longer history of service, will help your sales team fly. It’s why we’ve built an internal sales navigator tool to help our sales guys do their best work.
As we’ve seen, there are a lot of areas that can be tweaked to increase your sales velocity and improve your sales pipeline. Whether you decide to completely overhaul the process or optimise a few well-chosen areas, the effort is worth it if the pipeline starts flowing.


Share