Prospecting mails: is there any correlation between open rate and lead rate?
They say that in B2B sales getting a foot in a door is the most difficult thing. Email prospecting has been widely recognised as the winner in this category due to its universal applicability cross all B2B sectors, business sizes and departments. Naturally some of these are more likely to open and respond an email and the topic of discussion in this article will be:
Should we target just those departments, personnel and companies that at least open our prospecting mails?
Or even better: Is there a direct correlation between open rate and lead rate?
We’ve broken down nearly 100,000 mails sent in the last few months – to companies from a wide variety of sectors, of different sizes and addressing all levels of seniority within each. We wanted to understand what equivalence, if any, there is between the open rate of prospecting emails and the all-important lead rate that results.
We investigated:
- If campaigns with higher open rates produce more leads
- Whether targeting a Chief Executive Officer or a Head of Department will result in a higher open rate – and which produces a better yield of leads
- Which departments are more likely to respond positively to prospecting emails
- What effect company size has on both open and lead rates
Let’s share what we found out and reveal – SPOILER ALERT – why your open rates for a campaign do not offer a reliable measure of the likely success of your prospecting.
Benchmarking open rates and lead rates
We’ll kick off with some averages that we can use to test variances against.
In the months surveyed we sent just shy of 100,000 prospecting B2B emails. Each mail was highly targeted and tailored to the recipient, offering a quick summary of the benefits offered and an invitation to hop on a call to discuss things further.
We define a lead by any of three actions from the recipient:
- A positive response to the invitation
- A referral to another colleague
- The expression of deferred interest at another, perhaps less busy, time
Here, however, our interest is mainly in the relationship between overall lead rates and open rates. A lead will be treated as a lead whether it is a positive response, referral or an expression of deferred interest.
So, what did our open and lead rates average across all industries and prospecting companies?
But it’s the variances from the average that we’re really interested in here. Let’s see if there’s any correlation between open rate and lead rate, and where the two converge and diverge.
Open and lead rates by job function, company size and department
We’ve broken down the data by looking at job function, company size and department. The results may well surprise you – they certainly gave us plenty of cause to pause for thought.
Here’s the scores on the doors for different levels of seniority in the company.
Comparing open and lead rates by job function
We divided our prospects into five job functions:
- Owner, including founders and senior shareholders
- CXO, including COO, CTO, CEO, CIO, Chief of staff, partners, VPs
- Director
- Head of Department
- Manager
With an average lead rate of 3.71%, and an average open rate of 42%, we wanted to see exactly how each level of seniority may affect the outcome.
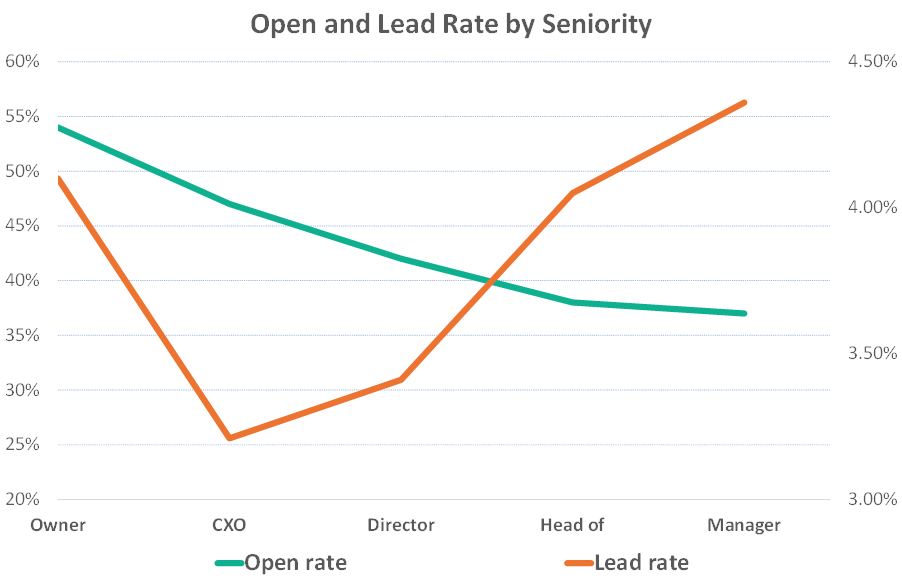
Surprisingly open rates are a bit higher the more senior the function.
Owners of businesses open 54% of all prospecting mails – and CXOs open nearly 20% less. After this the levels gradually drop, with the least senior function of Manager opening a bit more than 35%.
Yet, it’s the lead rates’ lack of correlation to this that is truly interesting.
The most responsive functions in terms of lead generation are Heads of Department and Managers – whose 3.7%+ lead rates are above the expected average despite significantly lower open rates. As an exception appear the Owners level which generate circa 3.5% lead rate.
As we suggested before when we looked at lead rates by job function, the strong performance seen here for owners of businesses (in terms of both open and lead rates) may actually be representative of the company size that is being targeted, rather than the role per se.
The owners targeted tend to be from much smaller companies and this may be skewing the data here. Indeed, of the 50,000 mails sent to owners there were 59% of these sent to companies employing less than 50 people.
Let’s take a look at the other ways that company size and lead/open rates may correlate next.
Variances in open and lead rates by company size
Again, the dotted lines here represent the average lead rate of 3.71% and the average open rate of 42%.
As can be seen there are significant variances when the number of employees in the company targeted is considered:
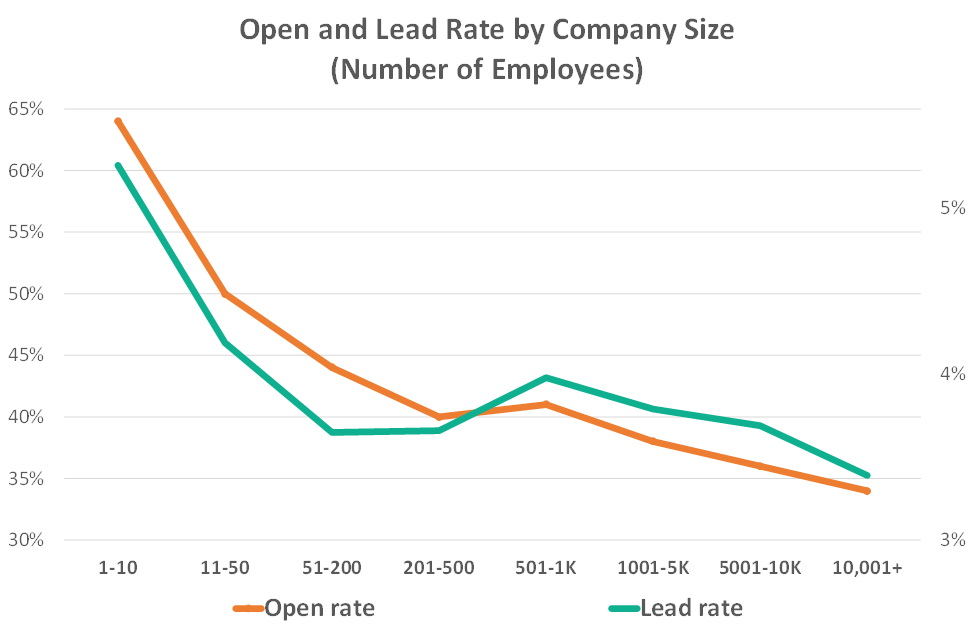
Open rates here correlate very strongly with company size. The smaller the company – the better the open rates. The same applies to lead rates so the willingness to review an invitation is mostly matched by resultant leads.
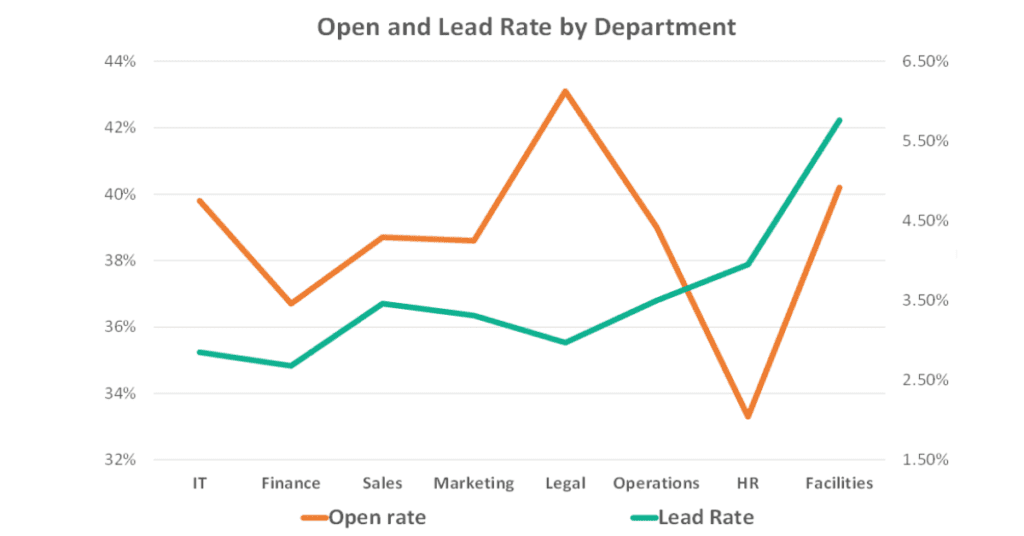
The effect of different departments on open and lead rates
Finally, let’s asses which departments are more likely to open prospecting mails – and which departments produce the most leads.
It’s the variance from the average that is telling – with the orange dotted line showing the average 3.71% lead rate and the blue dotted line marking the average 42% open rate.
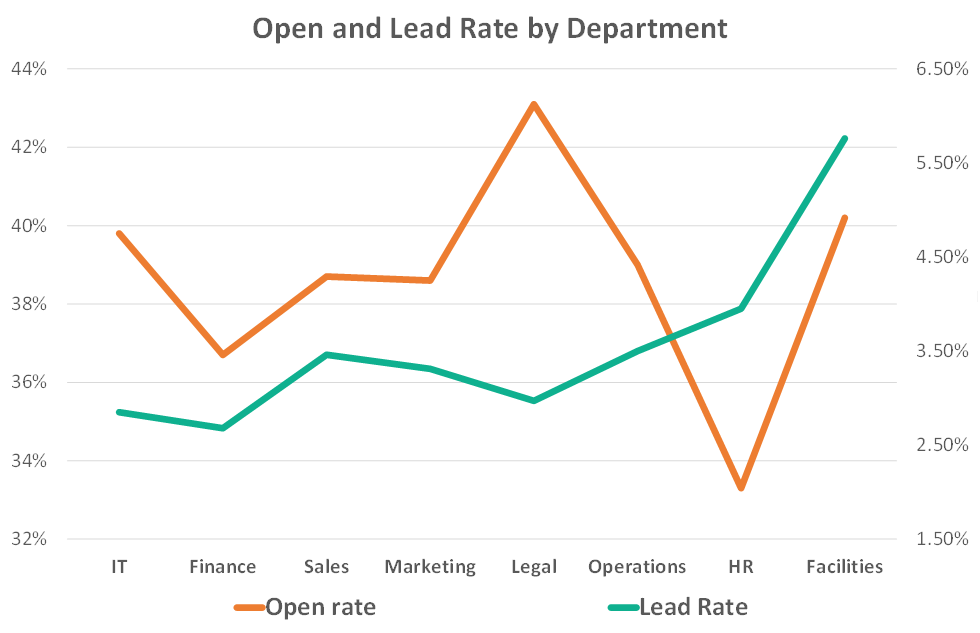
Just a quick point of clarification.
You’ll notice that most departments listed above (with a couple exceptions) fall below the average lead rate. This is simply because the departments represented are a subset of the entire data – the eight shown here account for just under half of the responses considered.
Only where a department can be unambiguously identified – and contains a statistically reliable number of responses – has the data been used here.
So, what does it show us?
Simply that, where the department of a business is concerned, that there is no direct correlation between expected open and lead rates.
- The IT department has second lowest lead rate – at just 2.25% – yet it has a very high open rate of nearly 40%
- Similarly, HR has the lowest open rate – at just 33.3% – but it yields the second highest lead rate – at 3.35%.
- Whereas high rates for both metrics are demonstrated by Facilities, which registers the second highest open rate – at 40.2% – and the highest lead rate – at 5.16%.
Is an email open a sales opening?
Across all of the prospecting variables that we have looked at there is no clear correlation between the proportion of opened emails and the number of leads generated.
There are clear-cut differences in open and lead rate that variables such as job function, company size and department produce. But, these two metrics do not correlate across the variables.
Quite simply an opened email is not a reliable guarantee of a foot in the door.
Those open doors sometimes close very quickly. Make sure you check additional performance indicators as lead rates.
For more insight from an award-winning B2B lead generation agency, read our ultimate guide to B2B lead generation.


Share