TAM, SAM, and SOM: How to calculate your addressable market
Summarise this article with:


In this blog
- What is market sizing?
- Now, let’s define TAM, SAM, and SOM
- Why TAM, SAM, and SOM matter
- Why do businesses use TAM, SAM, and SOM?
- How to use TAM, SAM, and SOM in market research
- Using TAM, SAM, and SOM in your business
- What is your real total addressable market?
- The pros and cons of TAM, SAM, and SOM
- The limitations of using TAM, SAM, and SOM

Before you pitch to investors, greenlight a product, or send your first outbound email, ask yourself one key question: Is this worth it?
Knowing your market size isn’t a tick-box exercise – it’s the backbone of smart business, marketing, and sales strategy. Without it, you’re making decisions in the dark, risking time, budget, and momentum.
That’s where TAM, SAM, and SOM come in. These three metrics are designed to bring clarity, helping you understand the size of the opportunity and the portion you can realistically win.
But here’s where many businesses get it wrong: market sizing often looks impressive on paper, yet falls short in practice. Big, top-down TAM figures don’t tell you how many companies actually fit your ideal customer profile, or whether you can reach the right decision-makers within them.
This guide will break down the what, why, and how of TAM, SAM, and SOM, while showing you how to calculate your addressable market in a way that reflects reality – not just theory.
What is market sizing?
Before you build a product, pitch to investors, or launch that go-to-market strategy you’ve been perfecting, there’s one fundamental question you need to answer:
How big is the opportunity?
That’s where market sizing comes in. Market sizing is the process of estimating the total demand for your product or service. It gives you a clearer picture of how much revenue is realistically within reach, and what it’ll take to get there.
Done well, market sizing removes the guesswork. It reveals whether your idea is targeting a billion-dollar market or a niche with limited upside. It helps prioritise resources, shapes your sales and marketing strategy, and adds real weight to your business plan or investor pitch.
And when it comes to breaking down market size into something useful? That’s where TAM, SAM, and SOM take centre stage.
Market sizing vs real market reach
Traditional market sizing focuses on estimating revenue potential.
But in practice, especially in B2B, there’s a more important layer:
- Can you identify the right companies?
- Can you reach the right person within them?
- And can you do it consistently, with accurate data?
Because if you can’t, your TAM isn’t actionable, it’s theoretical.
At Sopro, we treat TAM as a data problem, not a spreadsheet exercise.
→ Want to calculate your market size? Check out our market mapper tool to get full visibility on your prospecting pool.
Now, let’s define TAM, SAM, and SOM
First, we should clear something up: TAM, SAM, and SOM aren’t just startup buzzwords; they’re the building blocks of any solid go-to-market strategy.
Whether you’re pitching to investors or planning your next move, getting to grips with these three will help you understand the size of the prize (and how much of it you can realistically win).
What is TAM (total addressable market)?
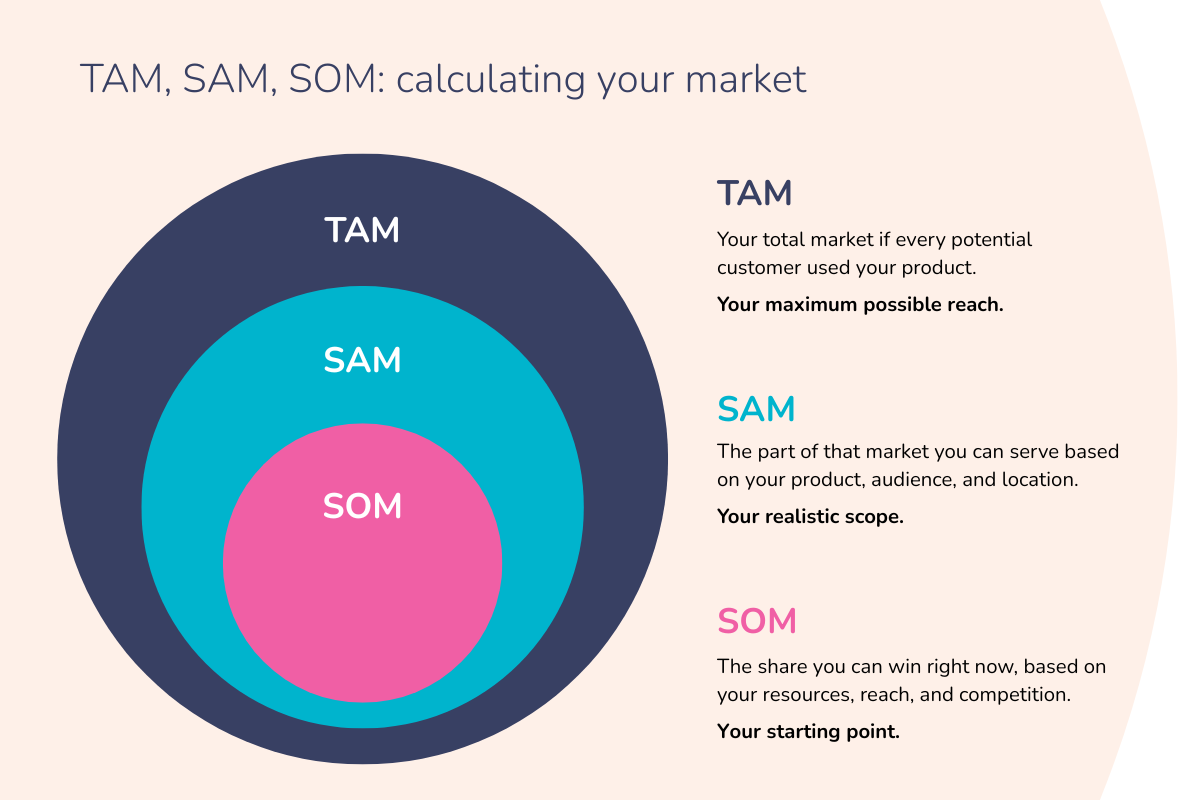
Your Total Addressable Market (TAM) is the big-picture number – the maximum revenue opportunity if your product or service were to dominate the entire market and capture every possible customer.
Think of it as the full pie. TAM shows the potential revenue if your solution had a 100% market share.
For example, if you’re launching an email marketing platform, your TAM could be the total global spend on email marketing tools. It’s a bold, broad figure, but that’s the point. TAM defines the upper limit of your business’s reach.
However, this is where traditional TAM calculations can fall short. Large, top-down estimates don’t tell you how many of those companies actually fit your ideal customer profile, or whether you can realistically reach the right decision-makers within them.
What is SAM (serviceable addressable market)?
Your Serviceable Addressable Market (SAM), sometimes known as the serviceable available market, is a smaller slice of that TAM pie – the part that’s relevant to your business model, audience, and capabilities.
Maybe your email platform is specifically designed for small businesses in North America. That narrows your TAM into a SAM: the total potential revenue from customers you could realistically serve.
SAM removes the fluff. It’s grounded in where your product fits and who you can reasonably target.
What is SOM (serviceable obtainable market)?
The Serviceable Obtainable Market (SOM) is the most realistic estimate of all – it’s the portion of the SAM you believe your business can actually win in the short term.
That means factoring in competition, internal resources, pricing, marketing power, and brand awareness. SOM is where you put your strategic hat on and ask: what market share can we realistically claim?
If your SAM is worth $1 billion but you’re a new startup with a small team and a niche audience, your SOM might start at $5 million. That’s not a weakness – it’s focus.
Why TAM, SAM, and SOM matter
Let’s be honest: figuring out your TAM, SAM, and SOM isn’t exactly a thrilling Friday night. But if you’re building a business, these acronyms are more than just pitch-deck filler.
Basically, they’re your market’s GPS. And, without them, you’re driving blind.
Here’s why they’re worth your time:
1. They help you talk like an investor
When someone asks, “How big is this opportunity?”, TAM, SAM, and SOM give you a structured way to answer without hand-waving or guessing. Investors want to know you’re aiming big, but also that you understand the real-world limits of your reach, especially early on.
2. They keep you grounded
It’s easy to dream about world domination, but SOM forces you to zoom in: What can we realistically capture in the next few years? That number isn’t about fantasy. It’s about team size, budget, marketing reach, and operational capacity.
3. They help you focus
Knowing your SAM means you’re not chasing every shiny opportunity. It’s the space where your product fits best, where your target customers actually live, and where you should focus your time and money.
4. They shape your growth plan
Understanding these numbers helps you work backwards: How many customers do we need to hit our revenue goals? Do we need to raise funding to do that? Or are we better off going lean and owning a niche?
But it’s important to remember: market size alone isn’t enough. In B2B, only a small percentage of your market is actively buying at any given time. What really matters is how much of your market you can actually reach, engage, and convert, not just how big it looks on paper.
Why do businesses use TAM, SAM, and SOM?
Businesses use TAM, SAM, and SOM to:
- Set realistic revenue goals
- Prioritise sales and marketing efforts
- Evaluate the viability of a product or business model
- Back up funding proposals with credible, data-driven insights
- Understand the competitive landscape and market saturation
Ultimately, TAM, SAM, and SOM help you size the opportunity, choose your battles wisely, and avoid the trap of building something that no one wants or for a market that doesn’t actually exist.
How to use TAM, SAM, and SOM in market research
Market research isn’t just about gathering data – it’s about spotting real, revenue-ready opportunities. TAM, SAM, and SOM help you do exactly that by turning broad market insights into clear, strategic direction.
Here’s how to apply them effectively:
1. Use TAM to understand the market opportunity
TAM (Total Addressable Market) gives you the big picture – the full revenue potential if every possible customer used your product or service.
In your market research, TAM helps you:
- Size up the entire industry
- Validate whether the opportunity is worth pursuing
- Set long-term goals or investor narratives
How to use it: Pull data from industry reports (e.g., Statista, Gartner), trade associations, or public competitor filings. Use this as your top-down estimate of total demand.
2. Use SAM to refine and segment
SAM (Serviceable Addressable Market) narrows the focus to the portion of the market you can serve, based on your current product, location, and target audience.
In research, SAM allows you to:
- Segment your audience by location, company size, or vertical
- Assess which market niches are most relevant
- Determine the fit between your product and customer needs
In practice, the most effective way to define your SAM is bottom-up. Instead of relying purely on industry estimates, start with real companies that match your ideal customer profile – based on factors like industry, company size, geography, and how well they align with your offering.
How to use it: Combine external data with your ideal customer profile (ICP). For example, if your TAM includes every company using CRM software, your SAM might only include UK-based SMEs in the financial sector.
3. Use SOM to forecast and prioritise
SOM (Serviceable Obtainable Market) is the share of the SAM you realistically expect to win in the short-to-medium term, based on your current resources, brand, and market position.
In market research, SOM helps you:
- Forecast revenue more accurately
- Prioritise go-to-market activities
- Set achievable sales and marketing targets
How to use it: Benchmark against similar businesses, factor in your sales capacity, and evaluate your competitive edge. If you’ve just launched, you may only initially target 1-5% of your SAM.
Why it matters
Using TAM, SAM, and SOM in your market research turns abstract numbers into an actionable strategy. You’re not just “doing research,” you’re building a roadmap:
- TAM gives you the vision
- SAM shapes your focus
- SOM keeps you grounded in reality
Together, they make sure your market research leads to better positioning, smarter spending, and stronger growth.
→ Looking for more? Our guide explores the role TAM and SAM play in B2B market segmentation.
Using TAM, SAM, and SOM in your business
Step 1 – Define your market and identify customers
Start by defining:
- Who your product is for
- What problem it solves
- Where your customers are located
- What they’re currently doing instead of using your product
This step is about focus. The clearer your audience and use case, the more accurate your market sizing will be.
Step 2 – Use a TAM calculation to find the total market size
Once you know who you’re targeting, it’s time to calculate TAM.
How to calculate the TAM
There are three main approaches:
- Top-down: Use industry reports (from resources like Statista) to find the total market size, then segment it to match your use case.
- Bottom-up: Start with your product pricing and customer count. Multiply the number of potential customers by your average revenue per user (ARPU).
- Value theory: Estimate TAM based on your product’s value and the price customers are willing to pay.
Example:
- There are 10,000 potential customers.
- Your ARPU is $2,000/year.
- TAM = 10,000 x $2,000 = $20 million.
→ Find out more about how to calculate TAM in our dedicated guide.
Step 3 – Find the SAM
Now apply practical filters. Who in that 10,000 genuinely fits your target audience?
How to calculate the SAM
Use geographic, demographic, or behavioural filters:
- Maybe only 4,000 of those businesses are in your region.
- Of those, 2,500 fall within your target industry.
- So, SAM = 2,500 x $2,000 = $5 million.
Step 4 – Find the SOM
Time to get real. Of those 2,500, how many can you realistically win in the next 1–2 years?
How to calculate the SOM
Take your historical performance or benchmark from similar companies:
- If you capture 5% of your SAM, SOM = 0.05 x $5 million = $250,000.
- If you’re new to the market, build a projection based on realistic growth rates, team capacity, and competitive differentiation.
Step 5 – Creating a strategy
With the SOM in hand, you can start shaping your strategy:
- Build sales targets from your SOM
- Develop marketing campaigns based on your SAM segments
- Use TAM to pitch your long-term vision
Market sizing isn’t just a one-off task; it becomes the backbone of your business planning.
→ Once you’ve determined your market size, it’s time for the next step. Master how to identify and contact your B2B target market in our guide.
What is your real total addressable market?
Traditional TAM gives you a high-level estimate of market size.
But in reality, what matters more is your real TAM – the number of companies you can actually sell to, and reach effectively.
That means:
- Businesses that genuinely fit your ideal customer profile
- Organisations where the right decision-maker exists
- Prospects you can contact using accurate, up-to-date data
Because if you can’t reach them, they’re not part of your addressable market in any meaningful sense.
Why reachability matters
Even if a company fits your targeting criteria on paper, there are still common gaps:
- The role you’re targeting might not exist
- Contact data may be outdated or inaccurate
- Emails may bounce, damaging deliverability
That’s why modern market sizing needs to go beyond spreadsheets and estimates.
From theoretical TAM to real TAM
Theoretical TAM is:
- Based on industry reports
- Built on assumptions
- Useful for storytelling
Real TAM is:
- Built from real company data
- Continuously updated
- Directly usable for outreach and pipeline generation
Your TAM isn’t static
Markets change constantly:
- People move roles
- Companies grow or pivot
- New businesses enter your market
That means your TAM should be treated as a living dataset rather than a one-off calculation.
TAM, SAM, and SOM in action: an example
Let’s say you’re launching a project management software designed for freelance marketing consultants in the UK.
TAM
Your TAM is the entire global market for project management tools. Think: Asana, Trello, ClickUp, Monday.com – every competitor, every customer, every country.
If global spend on project management software is estimated at £25 billion annually, that’s your TAM (if you somehow took over the entire world…nice idea, but probably not this quarter).
SAM
Your SAM is the portion of that market you could actually serve based on your product’s focus.
In this case, your tool is built specifically for freelance marketing consultants in the UK, not every business on the planet. Say there are 100,000 of them, and you charge £300/year for your software.
That makes your SAM: 100,000 x £300 = £30 million.
SOM
Your SOM is what you believe you can realistically capture in the next 12-24 months.
You’re new to the market, have a small team, and a modest marketing budget.
After analysing competitors, channel reach, and pricing, you estimate you could win 5% of your SAM in the near term.
That’s 5% of £30 million = £1.5 million SOM.
The pros and cons of TAM, SAM, and SOM
To help you weigh up whether TAM, SAM, and SOM are right for your business, explore the pros and cons.
What are the pros of TAM, SAM, and SOM?
- Clarity: Breaks big ideas into actionable targets
- Focus: Keeps you grounded in reality while still aiming high
- Investor appeal: Shows you understand your market
- Strategic planning: Informs everything from product roadmap to marketing spend
What are the cons of TAM, SAM, and SOM?
- Assumptions: Market sizing is always built on assumptions, which can be flawed
- Data availability: Good market data isn’t always easy (or affordable) to access
- Moving targets: Markets change, your TAM/SAM/SOM should be updated regularly
Still, the benefits far outweigh the risks, especially when your estimates are clearly justified.
The limitations of using TAM, SAM, and SOM
TAM, SAM, and SOM are powerful tools, but like any model, they’re only as good as the assumptions behind them. Used thoughtfully, they can clarify your strategy. Used blindly, they can just as easily lead you off course.
Before jumping into the TAM, SAM, and SOM pool, make sure you’re aware of these limitations.
1. Assumptions can skew reality
All three metrics are based on assumptions about market size, customer behaviour, pricing, and your competitive edge. Without grounding these assumptions in real, verifiable data, your TAM, SAM, and SOM can quickly drift away from reality.
Overestimate one of those inputs, and your figures can spiral into fantasy territory. That’s why it’s critical to validate your numbers with real data and industry benchmarks.
2. Data isn’t always easy to find
Solid market sizing requires solid data, which may not yet exist for niche markets or emerging industries. You could find yourself relying on outdated reports, loose proxies, or educated guesses.
Transparency is key: always disclose your sources and note where assumptions were necessary.
3. Markets change quickly
Your TAM today might look very different in six months. New competitors enter, customer behaviours shift, and economic conditions evolve.
Treat TAM, SAM, and SOM as a living model, not a do-and-done calculation. Revisit and update it as your product, team, and market mature.
4. Not all revenue is created equal
TAM can tempt you with big, shiny numbers, but it rarely tells the full story. Different segments of your market may require different levels of effort, cost, and support.
Winning 10% of a high-maintenance niche could be far less profitable than owning 2% of a leaner one. Size doesn’t always equal value.
5. It doesn’t replace customer insight
TAM, SAM, and SOM show you where the opportunities are – they don’t explain why customers buy or how you can stand out. Combine market sizing with qualitative research, customer interviews, and competitor analysis to build a well-rounded view.
When used wisely, TAM, SAM, and SOM offer a sharp lens on opportunity. But they’re not a shortcut to strategy, they’re a starting point. Pair them with research, critical thinking, and a healthy dose of realism, and you’ll be far better equipped to make informed, impactful decisions.
Expert advice on TAM, SAM, and SOM

How do I determine a realistic market share in SOM?
Benchmark against similar businesses in your space. If you’re entering a mature market with entrenched players, your SOM might start small (1-5%) and grow as your brand recognition increases. Be conservative but optimistic, and justify your estimate.
What timeframe should I use to project SOM?
Most businesses forecast SOM over a 12-24-month window. It’s enough time to gain traction but short enough to keep the estimate grounded. Long-term projections are better suited to TAM.
Should we include TAM, SAM, and SOM in a pitch deck?
Yes. Investors expect to see them. Just make sure:
- The numbers are sourced and credible
- You explain how they relate to your strategy
- You present all three – TAM for vision, SAM for focus, and SOM for realism
What assumptions are considered realistic when calculating TAM, SAM & SOM?
Avoid overly broad audience definitions. Use clear filters (industry, company size, geography). Defend your pricing assumptions with data. And don’t try to impress with huge TAMs unless they’re relevant to your actual go-to-market plan.
How can I calculate and defend TAM, SAM, and SOM figures effectively?
- Use multiple sources (industry reports, government data, surveys)
- Show your maths – don’t just drop numbers without context
- Be ready to tweak based on feedback or updated market conditions
How important is TAM compared to SAM & SOM?
TAM is your North Star; it’s the brush that paints the big picture (if we’re using elaborate metaphors).
But SAM and SOM are where execution lives. SAM helps you plan; SOM enables you to act. All three matter, but in pitch meetings and product launches, SOM often carries the most weight.
Done right, TAM, SAM, and SOM aren’t just a numbers game. They’re a roadmap to strategic clarity, sharper pitches, and better decisions. Are you ready to size up your market? Now you know exactly where to start.
Understanding your TAM, SAM, and SOM is a smart place to start. But turning that insight into leads, conversations, and closed deals? That’s where we come in.
At Sopro, we don’t just talk strategy – we deliver it. Our fully managed B2B lead generation service blends data-driven targeting with expert outreach across email, multi-channel campaigns, and account-based marketing.
Whether you’re chasing demand, setting appointments, or building high-converting pipelines, we’ve got the tools (and the team) to make it happen.
Ready to see TAM, SAM, and SOM turn into real leads? Check out our services or book a demo – we’re here to help.


Share